FLOW CHART
What is a flowchart?
A flowchart is a visual representation of the sequence of steps and decisions needed to perform a process. Each step in the sequence is noted within a diagram shape. Steps are linked by connecting lines and directional arrows. This allows anyone to view the flowchart and logically follow the process from beginning to end.
Common Flowchart Symbols
Different flow chart symbols have different meanings. The most common flow chart symbols are:
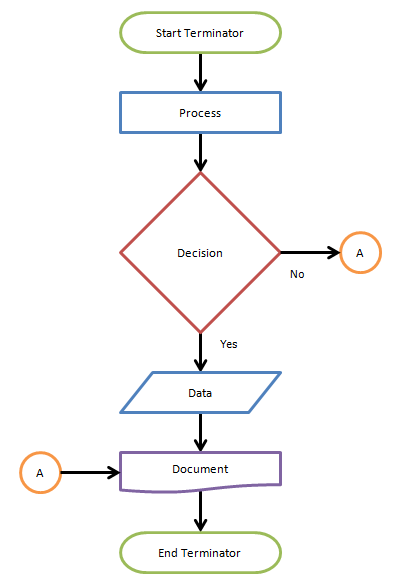
- Terminator : An oval flow chart shape indicating the start or end of the process.
- Process : A rectangular flow chart shape indicating a normal process flow steps.
- Decision : A diamond flow chart shape indication a branch in the process flow.
- Connector : A small, labeled, circular flow chart shape used to indicate a jump in the process flow. (Shown as the circle with the letter "A", below.)
- Data : A parallelogram that indicates data input or output (I/O) for a process.
- Document : Used to indicate a document or report (see image in sample flow chart below.)
A simple flow chart showing the symbols described above can be seen below:
BLOCK DIAGRAM
What is a Block Diagram?
A block diagram is a specialized, high-level flowchart used in engineering. It is used to design new systems or to describe and improve existing ones. Its structure provides a high-level overview of major system components, key process participants and important working relationships.
Why are block diagrams important?
A block diagram is an essential method used to develop and describe hardware or software systems as well as represent their workflows and processes. Block diagrams are used in electronics to represent systems and their shifting e.g mechatronic systems in the trucking industry.
Block diagram are generally used when the visualization of information or control flows is important - or when processes are involved. In this way we can represent complex algorithms or flows of information or communication among individual components within a large system as with, for example, in a facility designed for mass production. A graphical representation is often easier to understand than a textual representation.
Example of block diagram
PRESENTATION DAY
On 22 November 2017, I have done my presentation. My Final Year Project 1 Proposal Presentation have been assess by Dr. Zuhanis Mansor and Mdm. Lili Azwani Bt Tiron. The presentation went well. I manage to answer the question that my assessor ask and also I got some comment that i will use to improve my project...


VIDEO
No comments:
Post a Comment